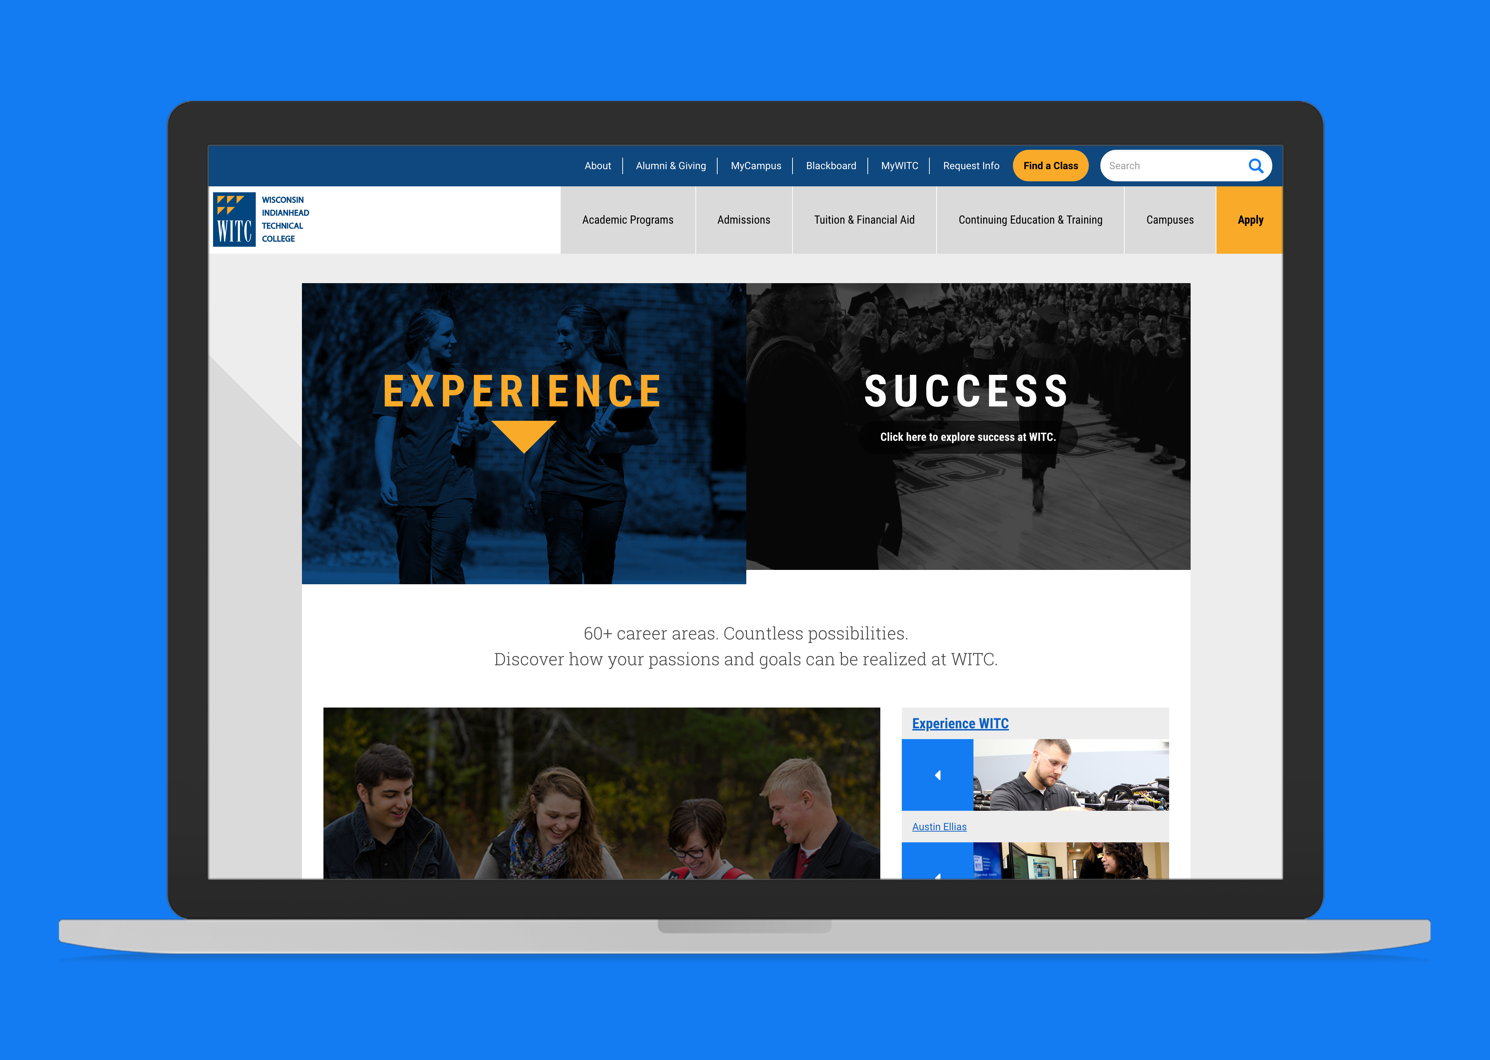
Northwood Technical College Website

Generating excitement and 6,000 new applications

Northwood Technical College is second-to-none in northwestern Wisconsin. To prove it, the college needed a website that could help prospective students explore its vibrant campus life and in-demand degrees and career paths. KW2’s solution? A responsive website design that delivers the brand’s Experience. Success. promise to more learners.

Insight

A survey of more than 500 users told us that prospective students were having a hard time imagining themselves on the Northwood degree path would lead them to a successful career. Meanwhile, current students needed smoothly integrated enrollment and course catalogue systems to make finding and registering for Northwood classes quick and easy.

Action

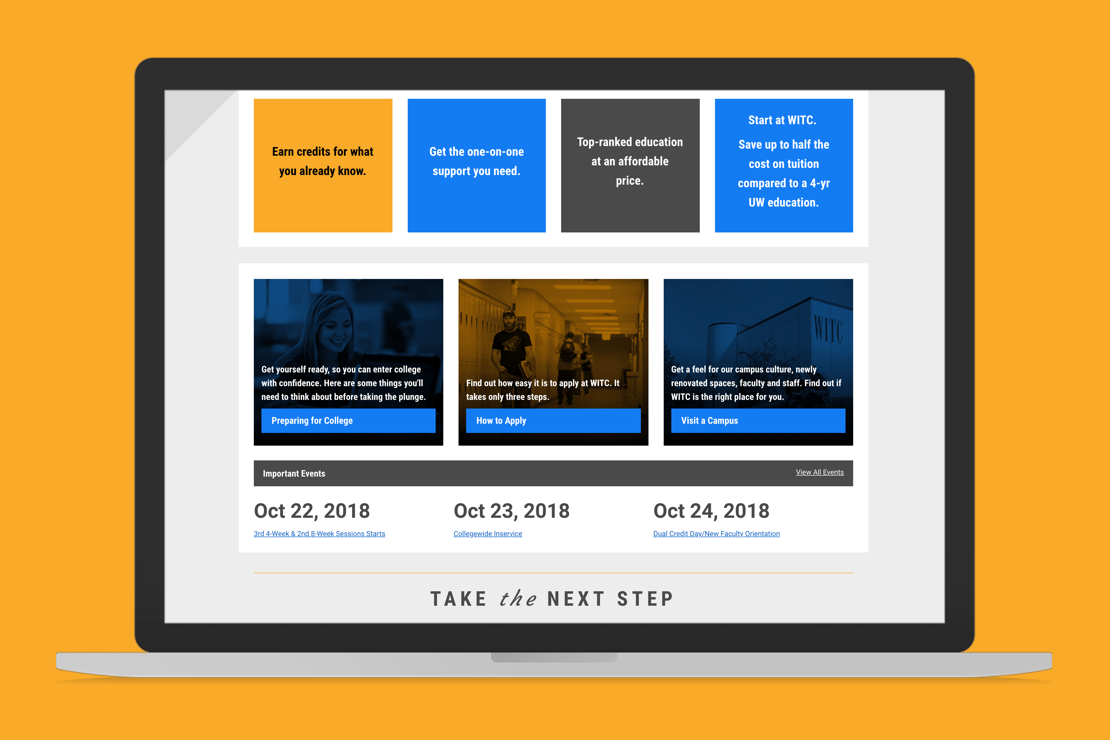
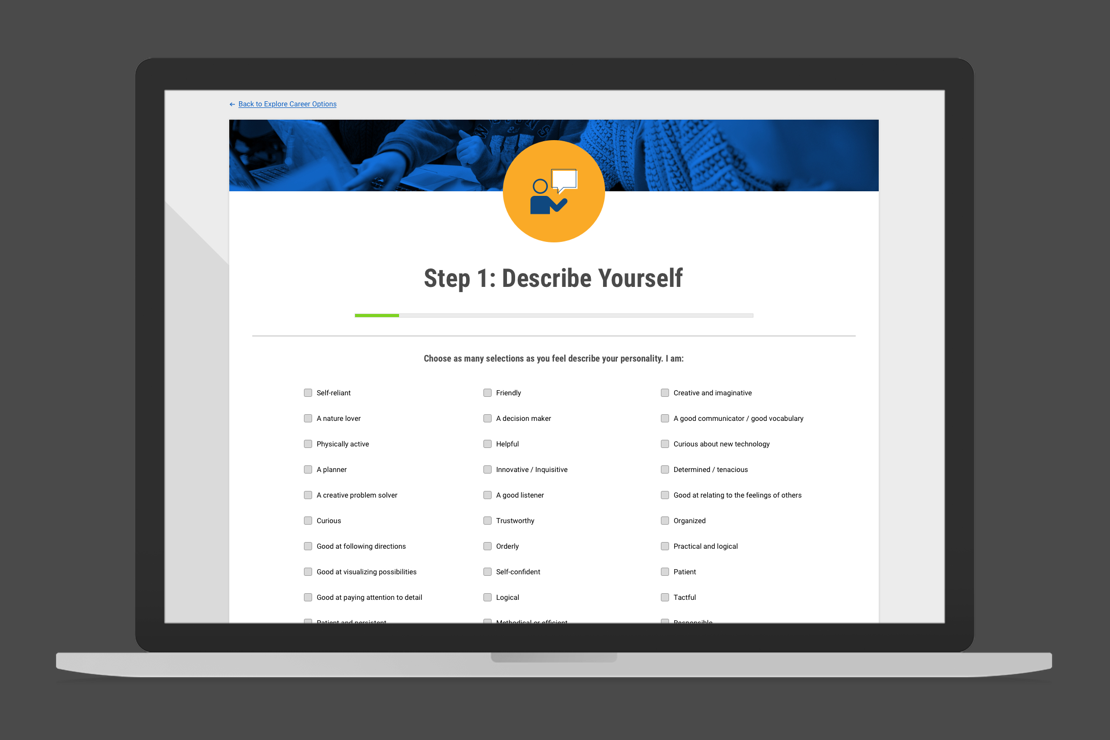
Our revamped content strategy introduced a host of engaging new rich media experiences, including student success stories and videos, interactive quizzes and data visualizations. We also worked closely with the college’s technical partners to successfully optimize the site’s key conversion points—application, enrollment, course search and registration.

Result

Northwood Technical College’s new research-driven, responsive site design has streamlined course registration and helped boost admissions—generating more than 7,600 new applications in the first 6 months alone. Site-wide event tracking and analytics are also up and running, revealing increased engagement, lower bounce rates and more admissions-bound clicks. Success experienced.

“I would definitely hire KW2 again if we were to go through another web redesign. Their whole team was very organized, inclusive and upfront throughout the whole process. KW2 really helped us understand our internal and external stakeholder needs. They had the right expertise to do the job well, and I always felt I could lean on them to help me.”

Jena Vogtman, Marketing Director, Northwood Technical College

New Applications

Graphic of open laptop showing an increase of 6,000 new applicants

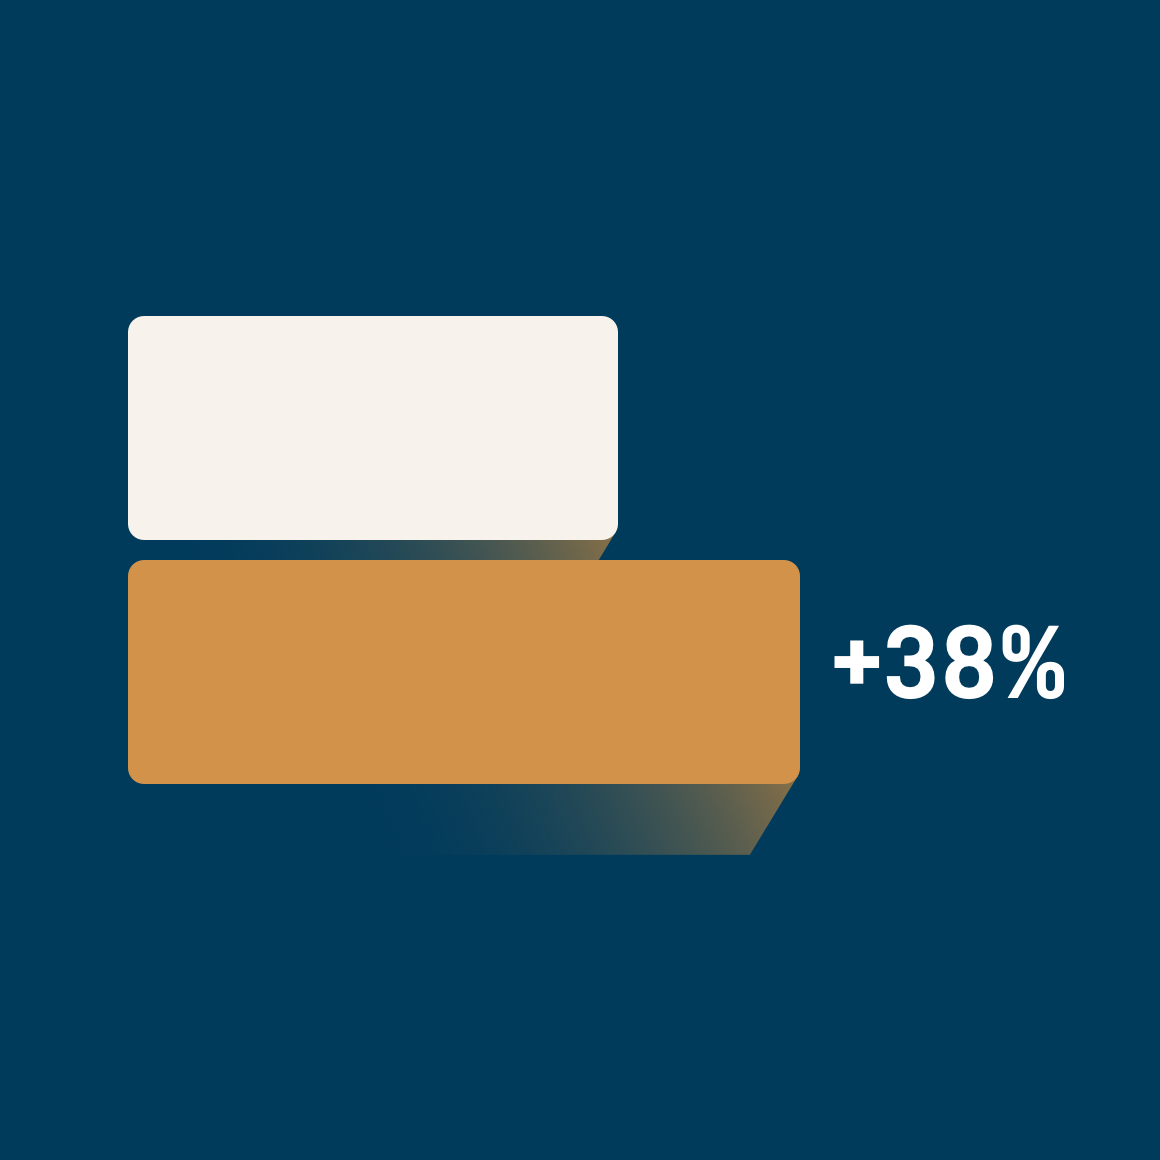
Average Session Duration

Bar graph showing a 38% increase in session duration

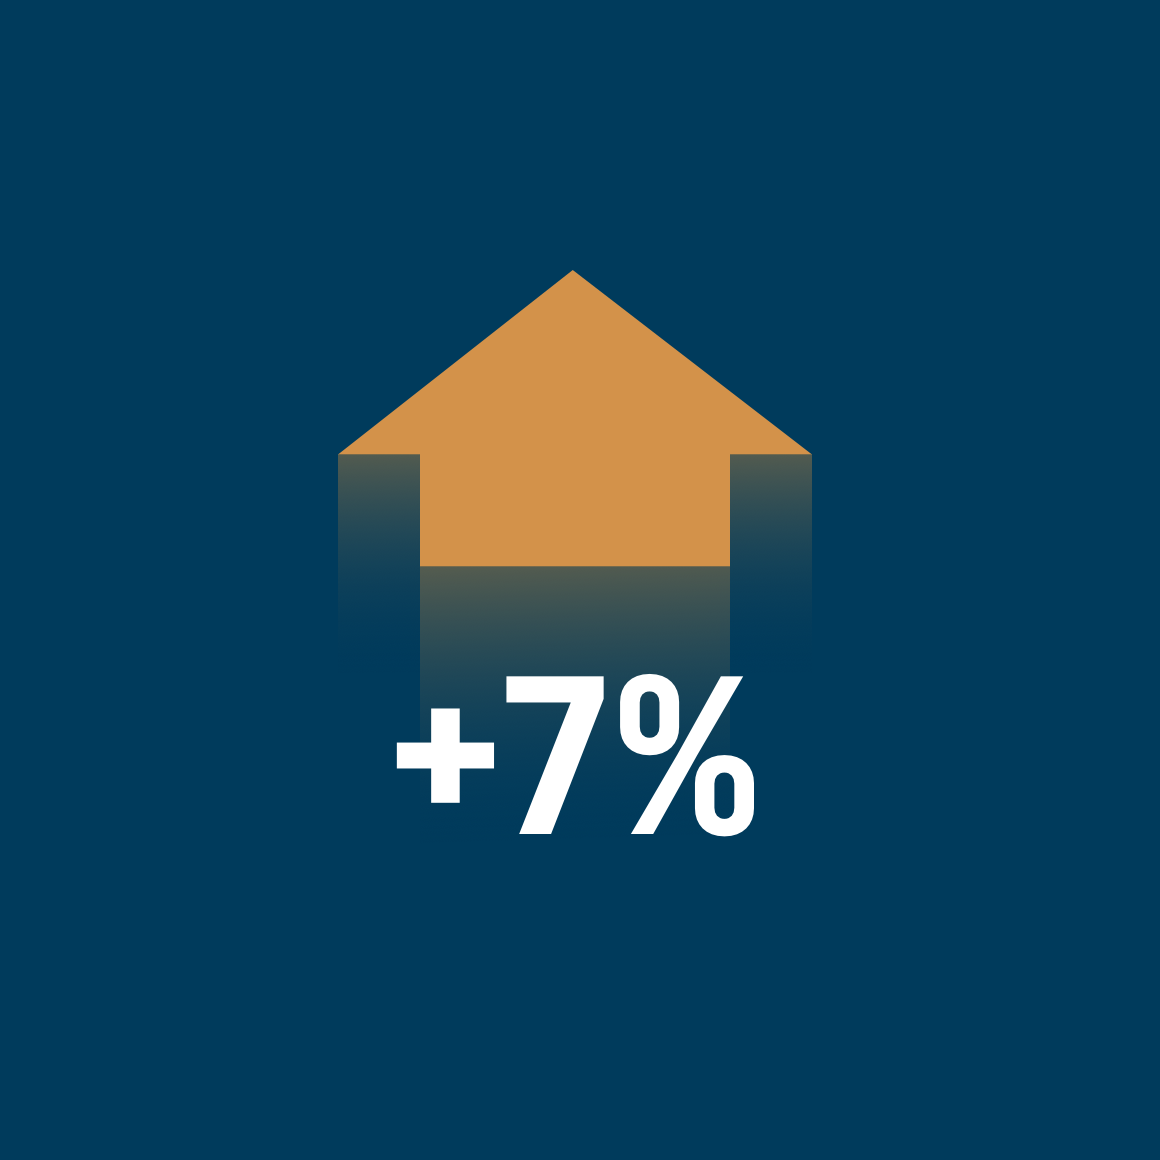
Page Views Per Session

Graphic with up arrow displaying a 7% increase in page views per session

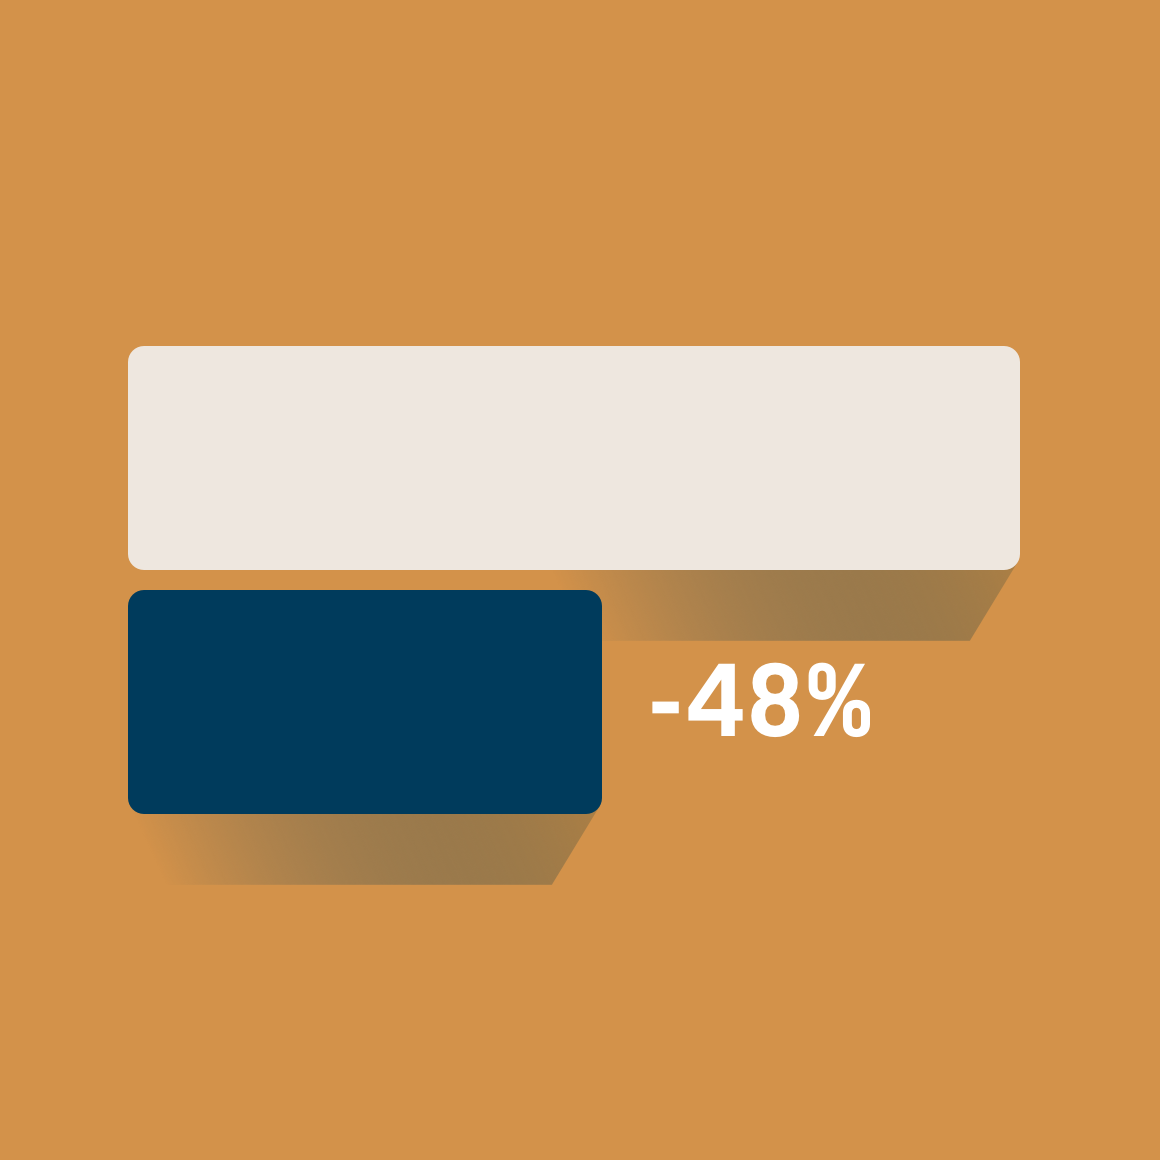
Bounce Rate

Bar graph showing a 48% decrease in bounce rate

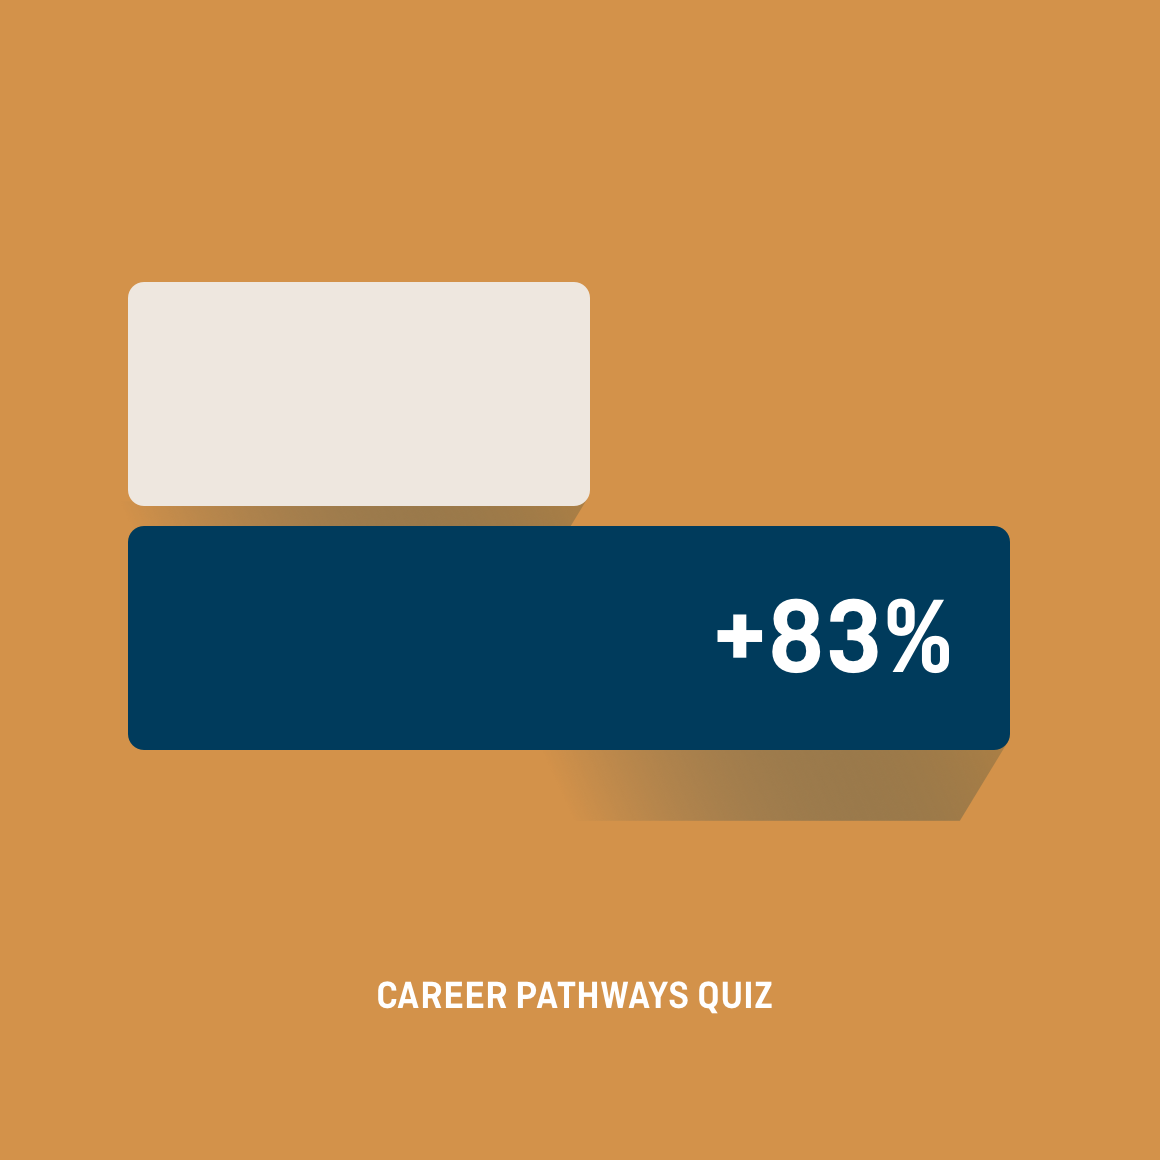
Engagement

Bar graph showing a 83% increase in engagement with career quiz
Hand holding mobile device with WITC mobile app on screen

aptop graphic showing WITC website on screen
Laptop graphic showing WITC website quiz on screen
Ten icons made for WITC

Related Work